View Projections
The Projections View displays projection result for your each scenario in three views:
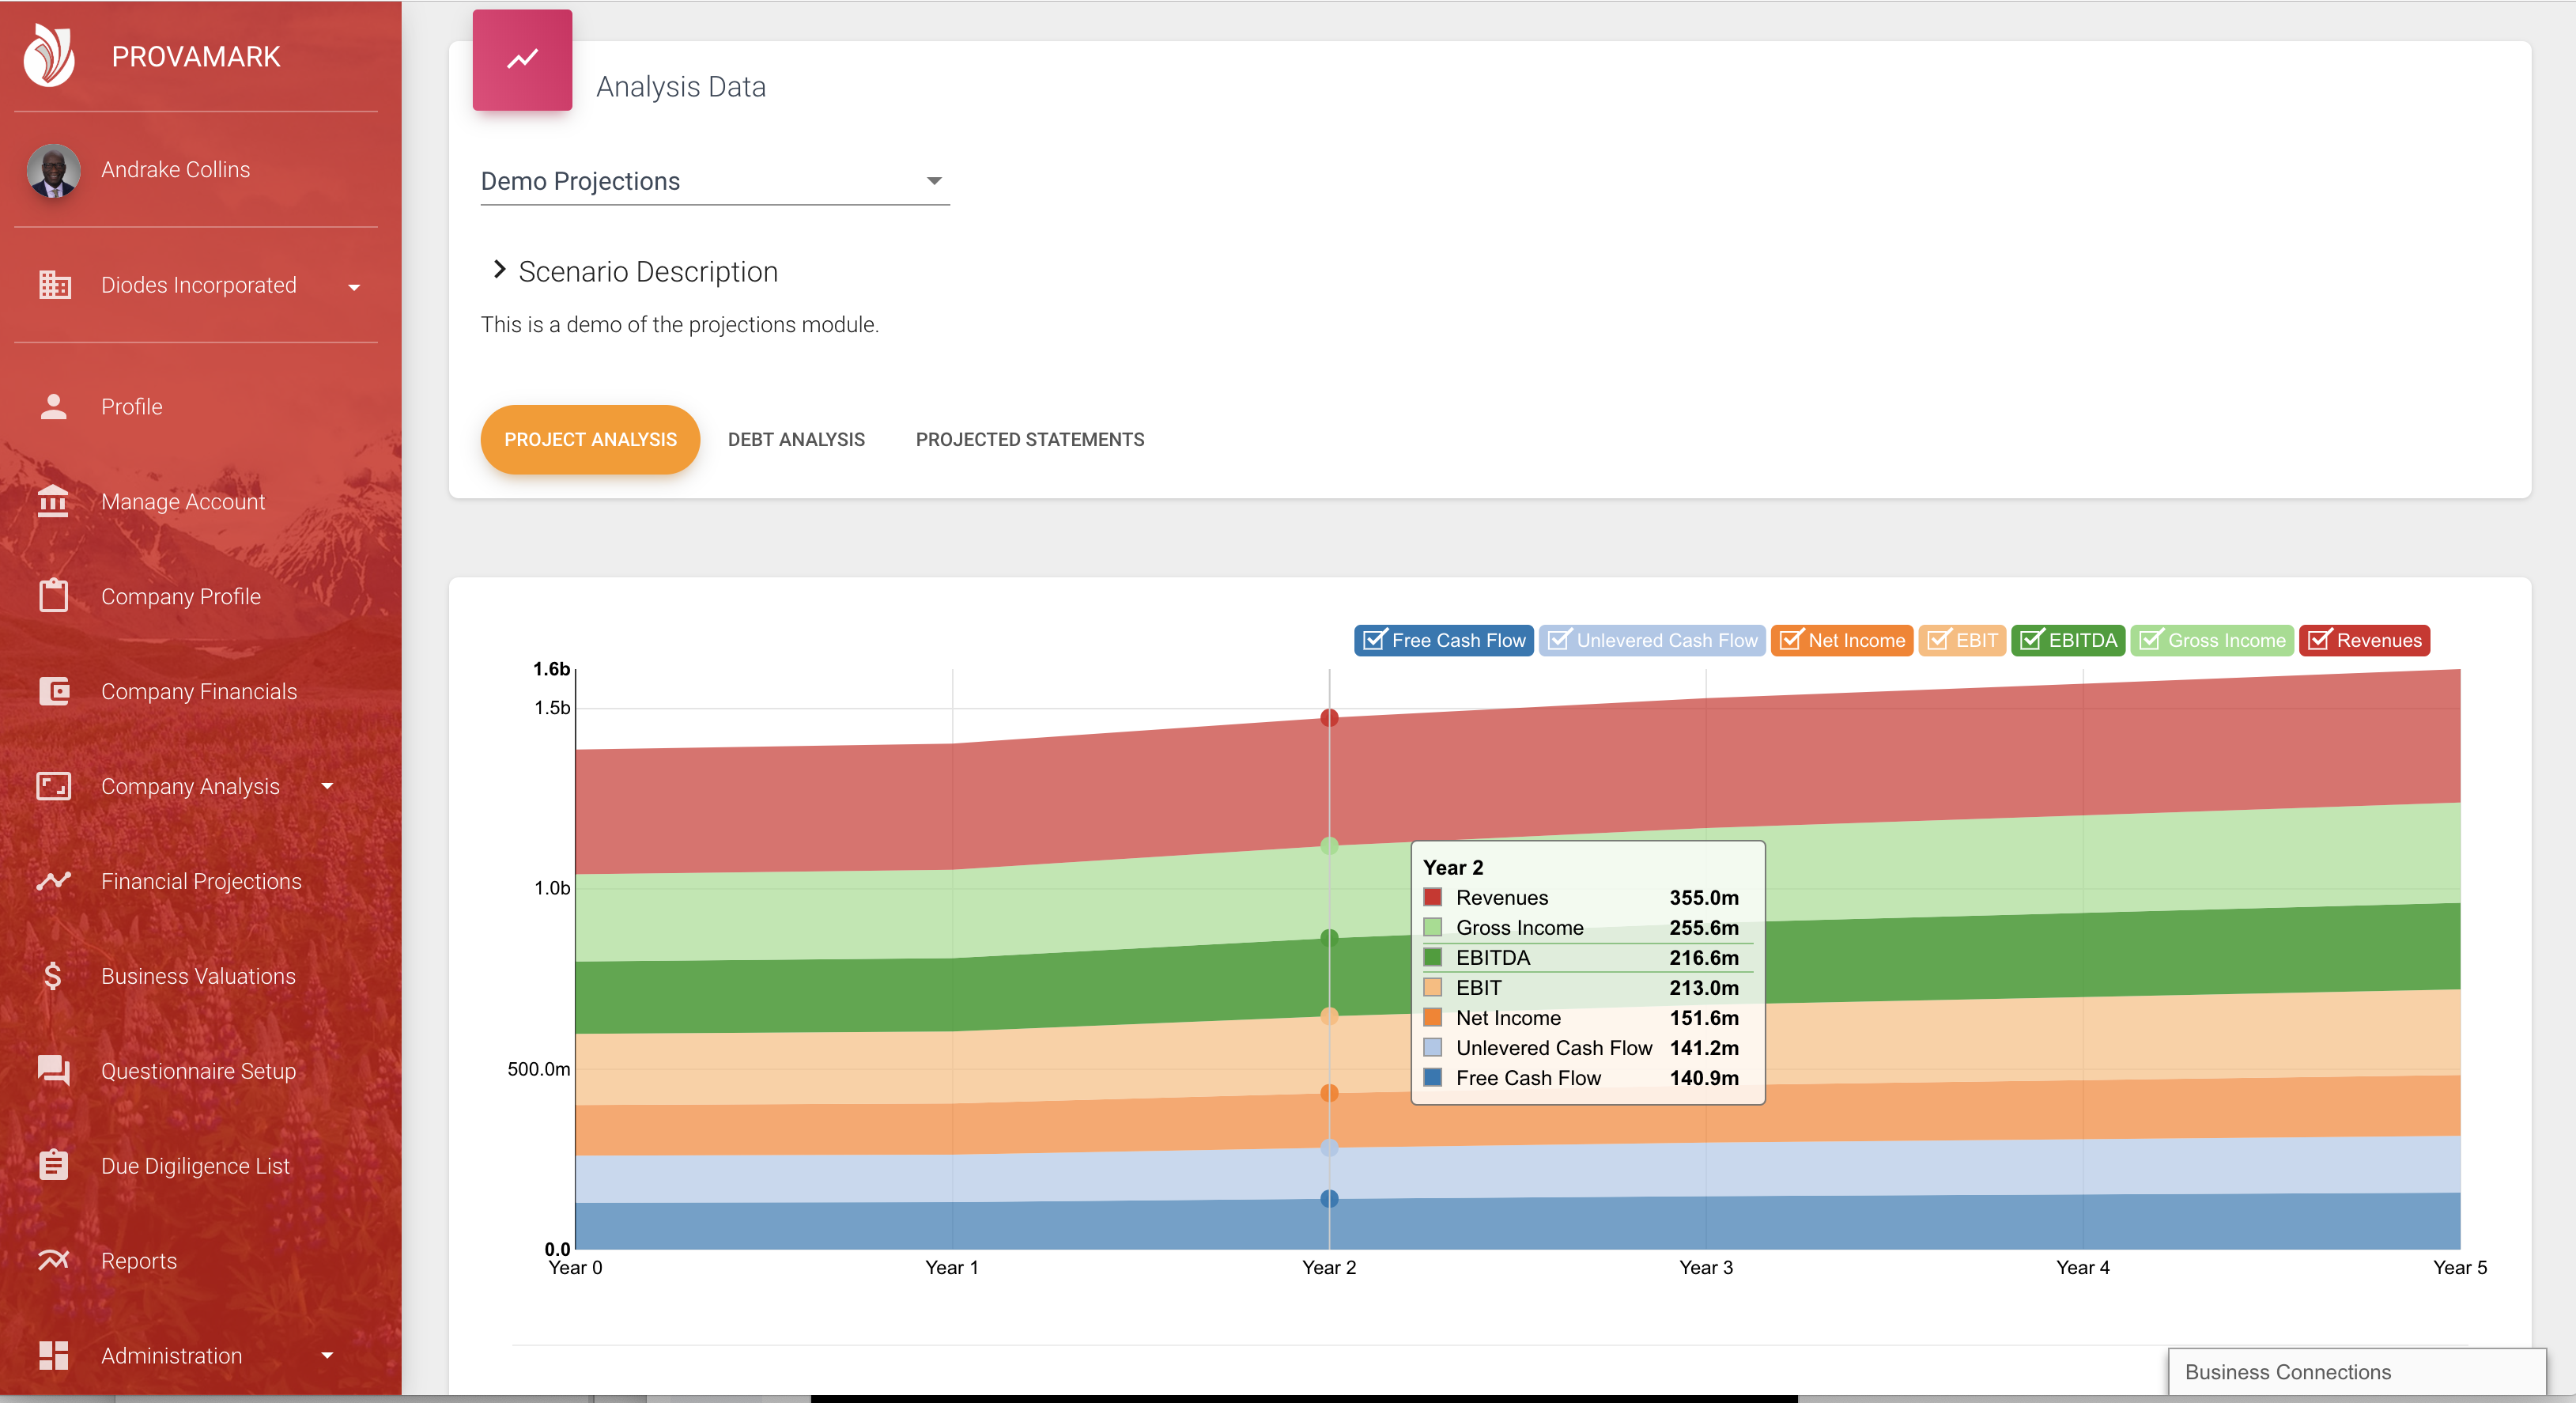
Projection Analysis
A graphical view of the projection results. The top chart displays view of projected amounts. The bottom chart displays view of projected margins.
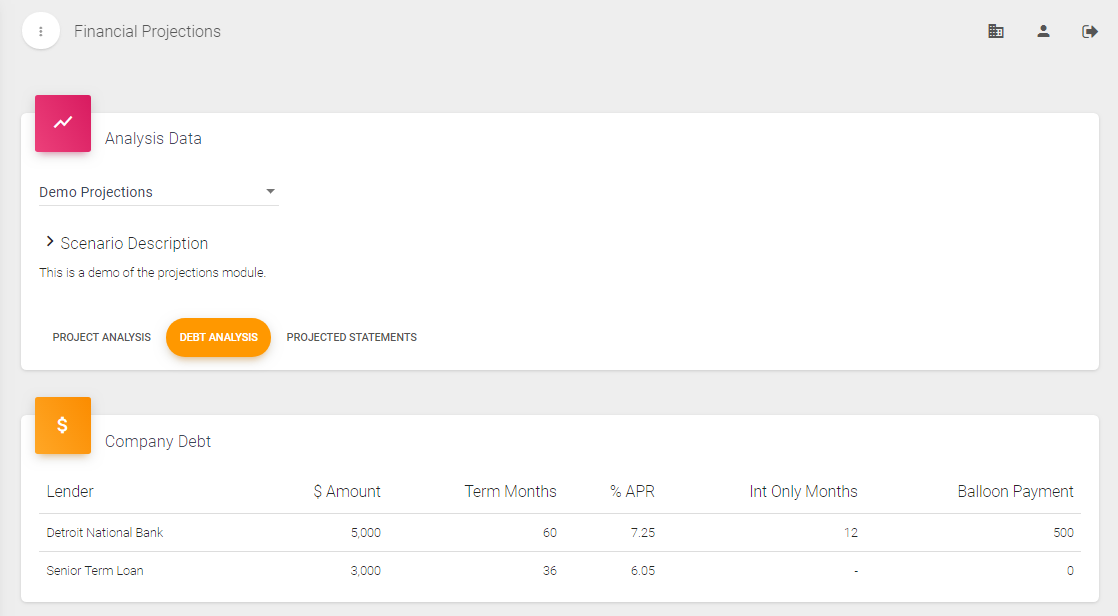
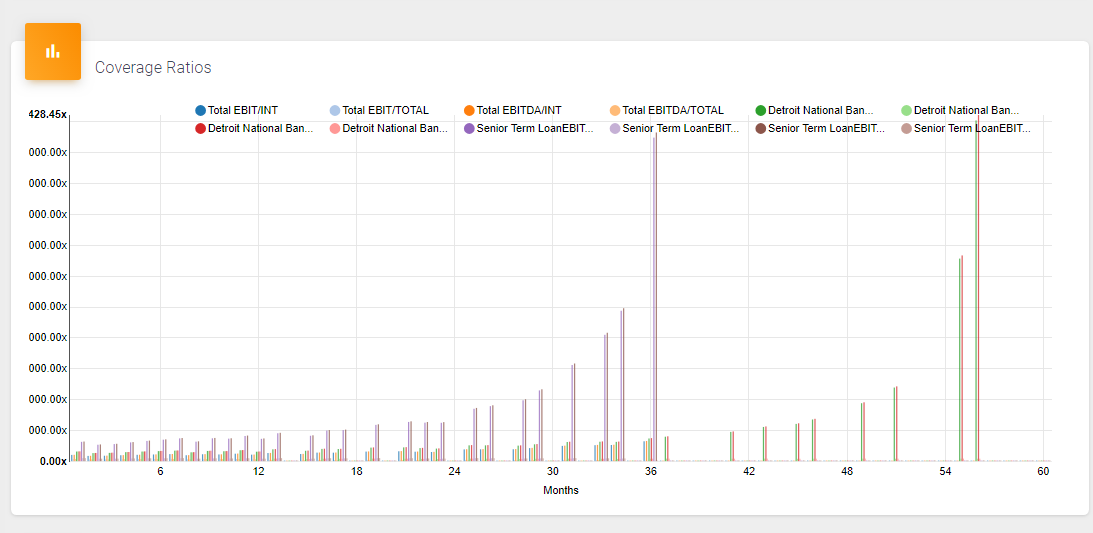
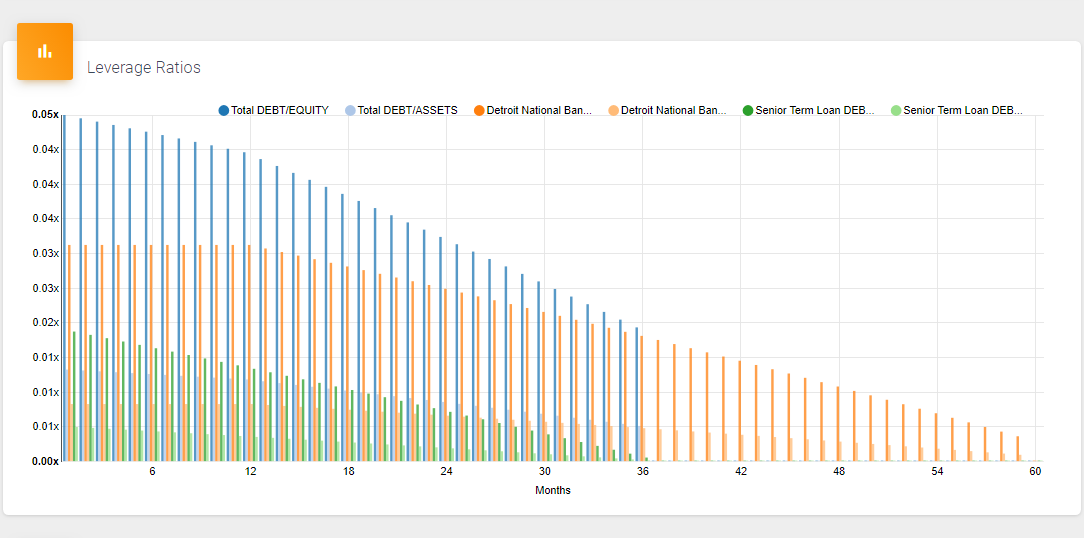
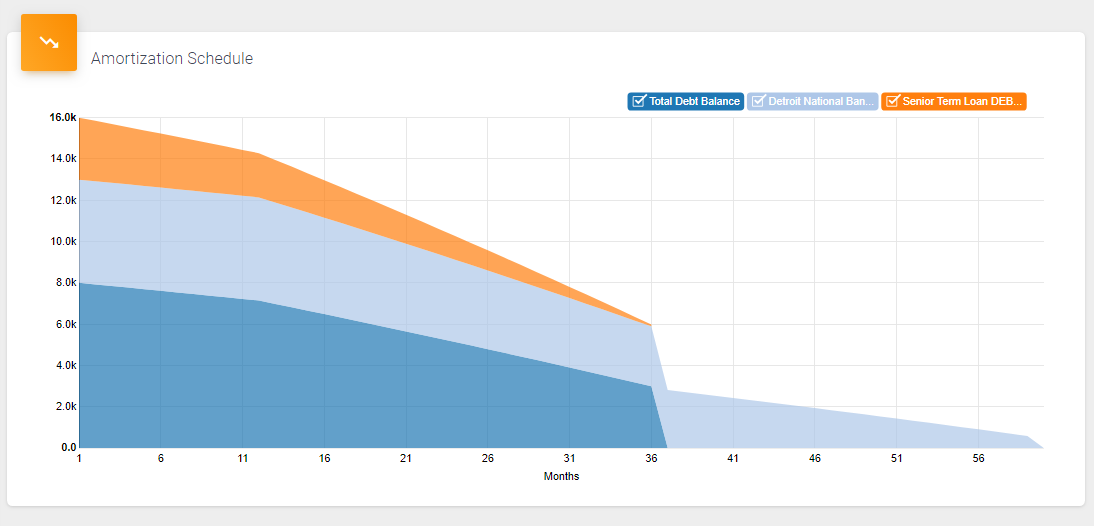
Debt Analysis
Amortization tables and coverage ratios are calculated for each debt setup in the scenario. Figures are displayed for each debt and for the company total.

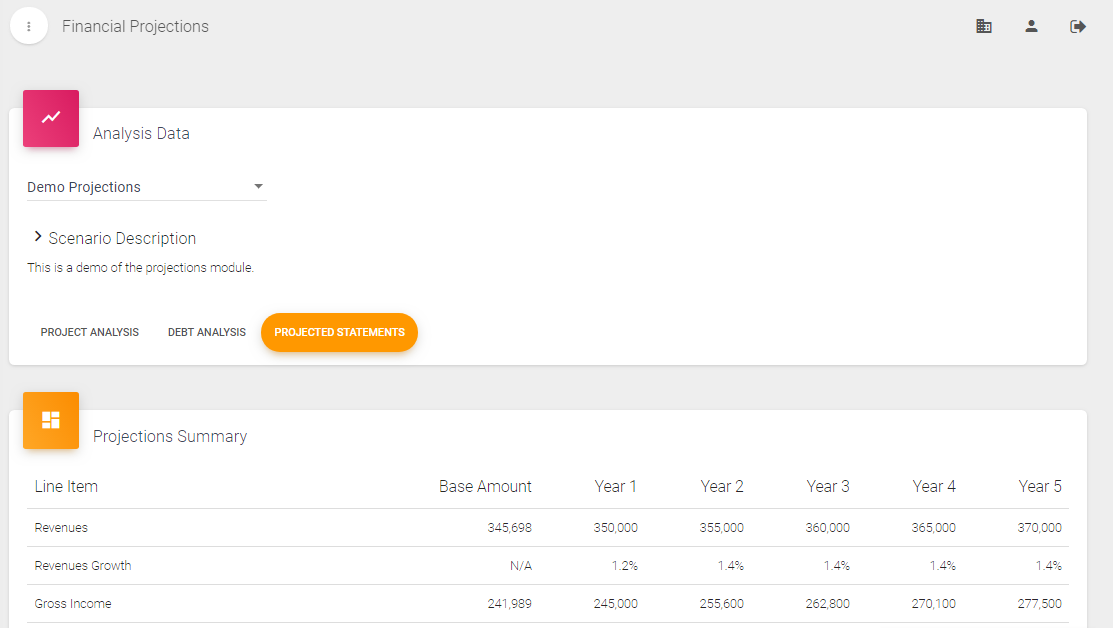
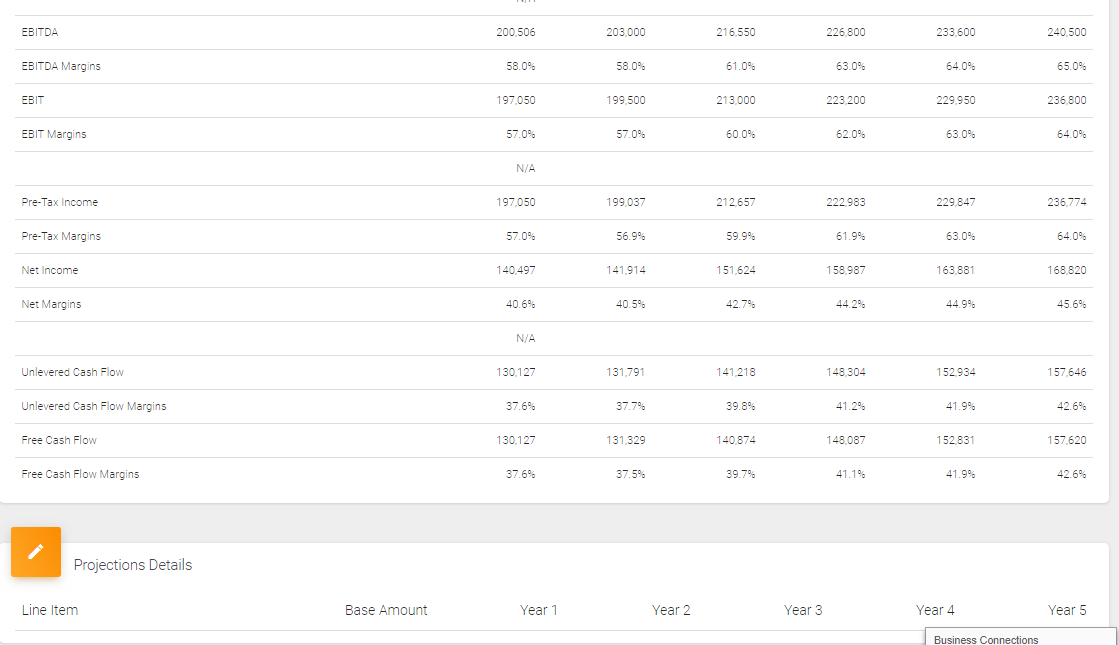
Projected Statements
The Projected Statements show a spread of the projected amounts. The top table shows the summary projections. The bottom tables shows line item details for any line item selected from the top table.